Conclusion
While you go take a look at the resulting file, I’ll be on my way. Today we were able to see how we can use R to fully (and more easily than it seemed at first) create, modify and save plots.
Graphs –done right– are often the most efficient way to convey ideas about our data, and R offers powerful tools to do that.
For the last section, we’ll see how we can create our own functions. The funniest part if you want my opinion!
INTRODUCTION
Graphs so pretty, you'll want to display them on your fridge.

GETTING INFORMATION
Or how to interact with your graph!
SAVING A GRAPH
Saving your art for posterity to see.

THE “PLOT()” FUNCTION
A picture is worth a thousand words. Here is how to make a graph worth twice that.

MORE GRAPHICAL FUNCTIONS
Want a histogram? A boxplot? A barplot? You came to the right place!

ADDING ELEMENTS
A look at putting finishing touches to your masterpiece.

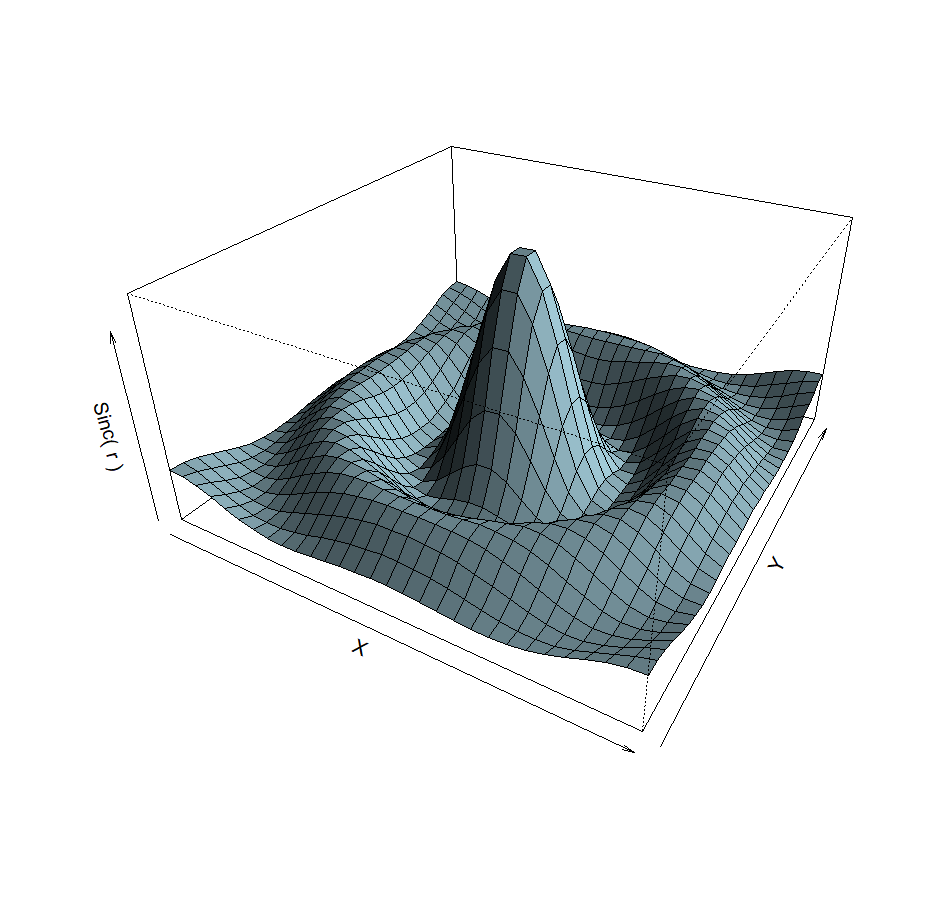
A LITTLE BIT OF 3D?
2D is so 1990. 3D is the future.