Graphs and plots

Graphs and plots

Ok, you got results. Nice. It’s significant? Even better! But you know what would make it even better? If we could make it “sexy”!!! Yep, few people enjoy looking at a table (and the ones that do are not the fun ones at a party!), but everybody loves graphs and plots!!! You don’t know how to do this? This is overwhelming? You can’t breathe? Don’t worry, you just need some R (“bilingual” pun for the win!).

I’m not going to lie to you: while I grasped almost immediately the potential that R offers in terms of graphs, I almost as quickly thought that it would be too difficult to actually make nice plots without the use of a mouse! The first time I had to mess around with graphics in R, I got so frustrated that my first (and for a long time after that) response was to export my data to plot my results in Excel… Yep. I did that.

But since then, I found myself in situations where I had to repeatedly make series of graphs with different datasets, and Excel taking 5 minutes at least per graph was not an option. (and on top of that, I also understood that Excel’s graphs are awful for scientific purposes!) So, I armored myself with my most powerful pre-emptive grunts and rants, and decided to finally try to make a nice graph in R.

And because it was not as difficult as I first imagined, and also because I’m a decently nice guy, I’ll try to save you some of the troubles I went through by showing you the basics of a nice graph in R, and some of the available options. I mean, just take a look (in R, it would take too much place to do it here!):

demo(graphics)
demo(image)
demo(persp)

You can also check out more example by entering in the function “example()” the name of some plotting function such as “plot”, “barplot”, “boxplot”, “dotchart”, “coplot”, “hist”, “fourfoldplot”, “stars”, “image”, “contour”, “filled.contour” or “persp”. Those are simple demonstrations of what functions that are already included in R can do in terms of graphics! Neat, isn’t it? Let’s take a look at some of them, and at the basics of plotting in R. Shall we? Not much theory here, practice!

First things first, let’s make sure to have some data to work with. We should have all the data we need in our previous session!

load("OurWholeData(3).RData")

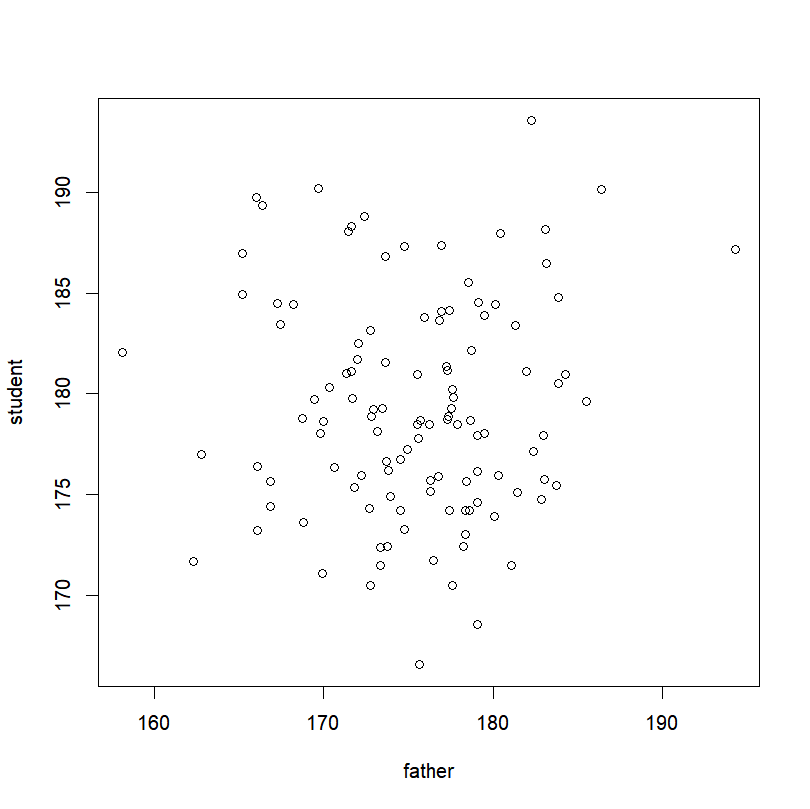
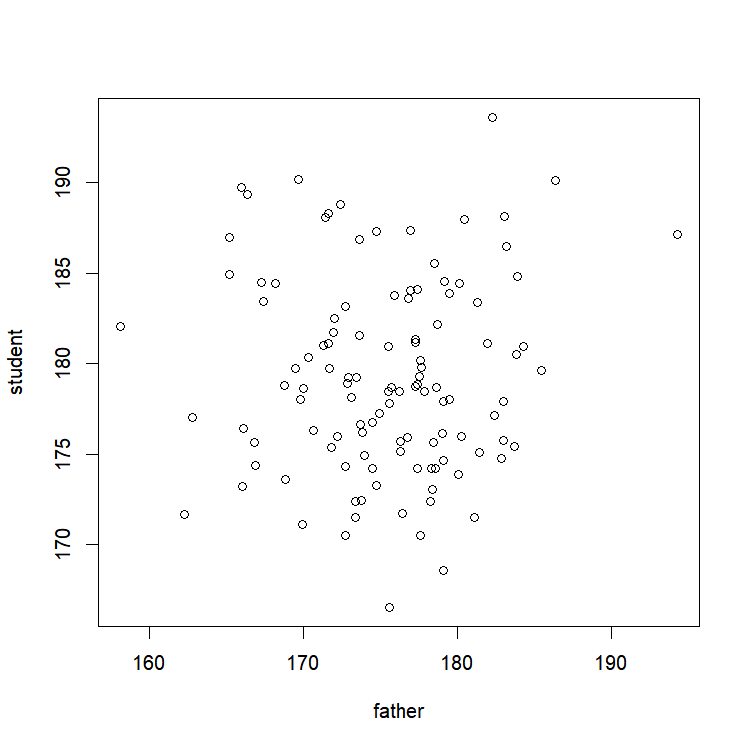
THE “PLOT()” FUNCTION

A picture is worth a thousand words. Here is how to make a graph worth twice that.

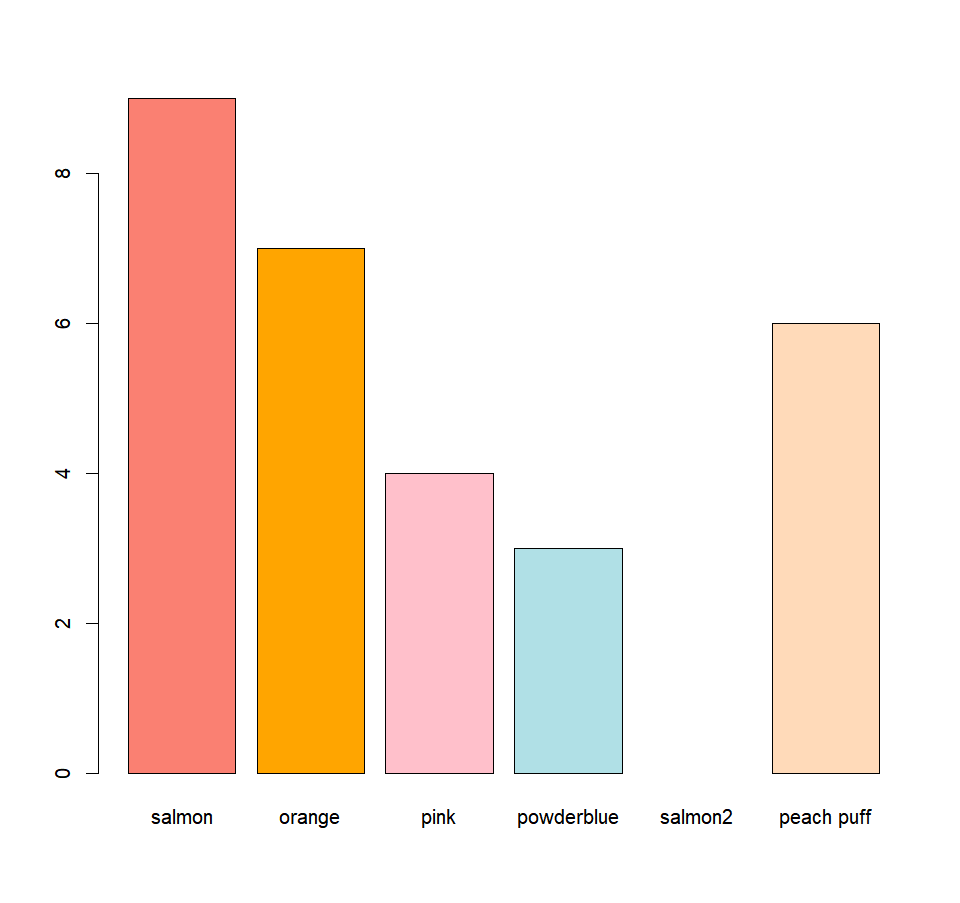
MORE GRAPHICAL FUNCTIONS

Want a histogram? A boxplot? A barplot? You came to the right place!
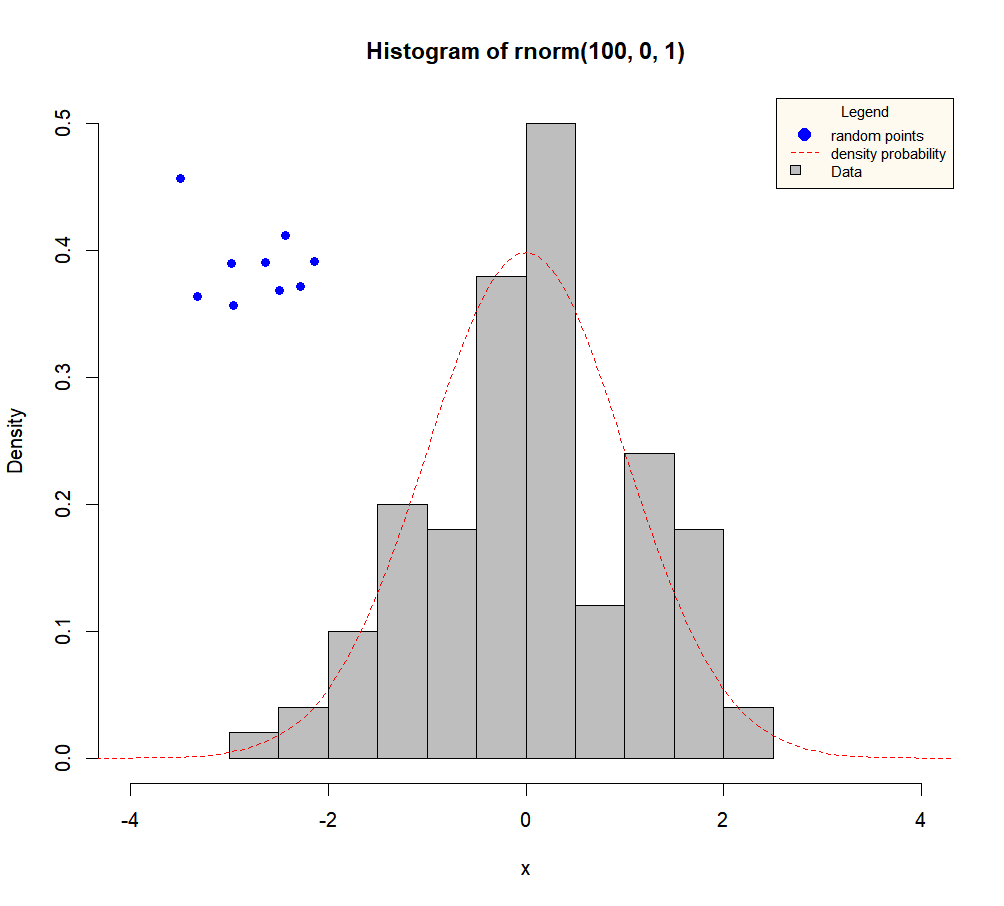
ADDING ELEMENTS

A look at putting finishing touches to your masterpiece.
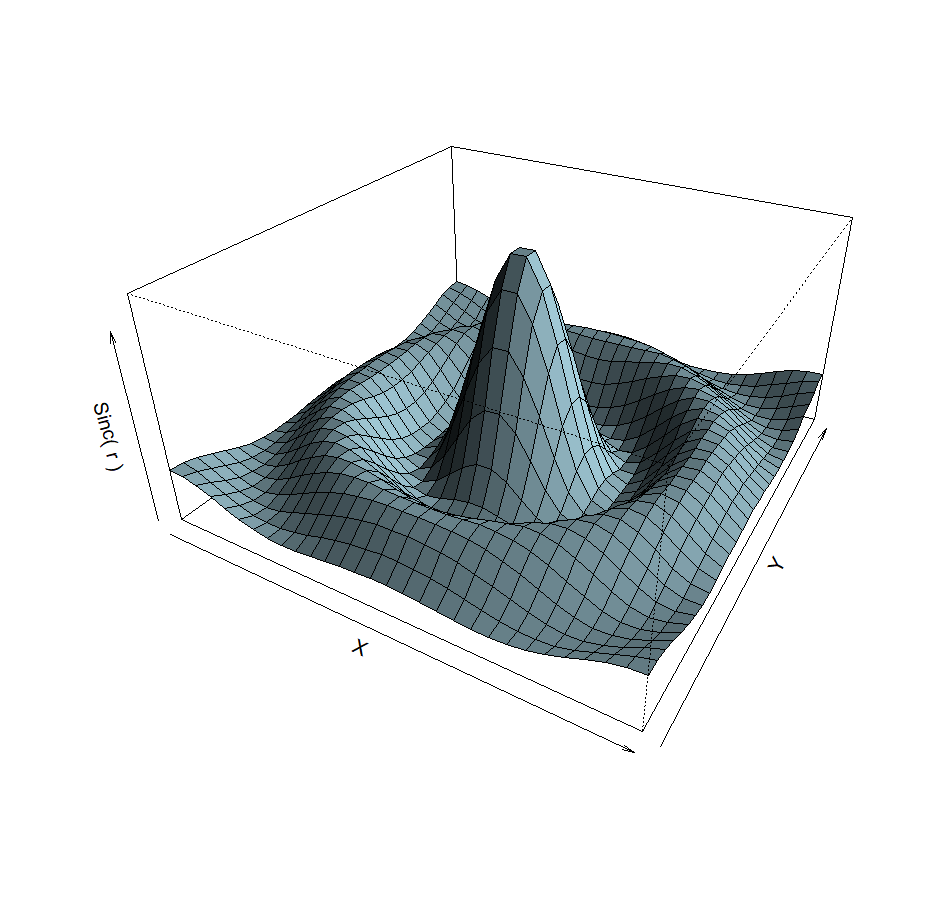
A LITTLE BIT OF 3D?

2D is so 1990. 3D is the future.

GETTING INFORMATION

Or how to interact with your graph!

SAVING A GRAPH

Saving your art for posterity to see.

CONCLUSION

Go. Be proud. You have the right to.