Playing with your data
Now that we have a general idea about how things work in R, let’s see how to handle data and get some general information about them! Let’s face it, the introduction was probably a little “dry”. It’s without a doubt more interesting to deal with your data! But that was a necessary evil! In this section, we will take a look at how to handle our data, and how to get some general information and visualize them.
First things first, let’s make sure to have some data to work with. Remember how to load our data from a previous session?
load("OurWholeData.RData")You did not forget to modify this (if needed) to match where you left your file last time, did you?
What about a little heads up on what we had created last time:
ls()
[1] "awesomeness" "bear"   "bear2"       "cafeteria"   "classes"
[6] "color"      "data"   "fear"        "library"     "numfac"
[11] "randomdata"  "Roger" "shirts"      "students"    "tmp"
[16] "vec"        "vec2"
Now, imagine we want to get a summary of what a specific object is. How can we ask R to help us with that? Simply with the function “summary()“! I told you that nothing could be more intuitive than R! What? I didn’t tell you that? Well, good, because that would be lying. But in this case, it’s pretty straightforward, right?
summary(color)
 Length     Class  Mode
      6 character character
summary(shirts)
   color awesomeness
 orange    :1  Min.   :3.0
 peach puff:1  1st Qu.:4.0
 pink      :1 Median :6.0
 powderblue:1  Mean   :5.8
 salmon    :1  3rd Qu.:7.0
 salmon2   :1  Max.   :9.0
         NA's   :1
summary(awesomeness)
Min. 1st Qu.  Median    Mean   3rd Qu.    Max.    NA's
3.0   4.0       6.0      5.8     7.0      9.0       1
summary(bear)
       col1          col2            col3         col4
 Min.   :1.500 Min.   :1.980    Min.   :2.140    Min.   :2.930
 1st Qu.:1.750 1st Qu.:2.075    1st Qu.:2.355    1st Qu.:3.165
 Median :2.000 Median :2.170    Median :2.570    Median :3.400
 Mean   :2.083 Mean   :2.390    Mean   :3.050    Mean   :3.597
 3rd Qu.:2.375 3rd Qu.:2.595    3rd Qu.:3.505    3rd Qu.:3.930
 Max.   :2.750 Max.   :3.020    Max.   :4.440    Max.   :4.460
As you can see, depending on the type of object we are asking a summary for, the response will be different. This function is what is called a “generic function”, it can be applied to a variety of objects, and the returned value will follow a format specific to each class.
BASIC STATISTICS
Mean, standard deviation, median? We got it all, and it's right here!
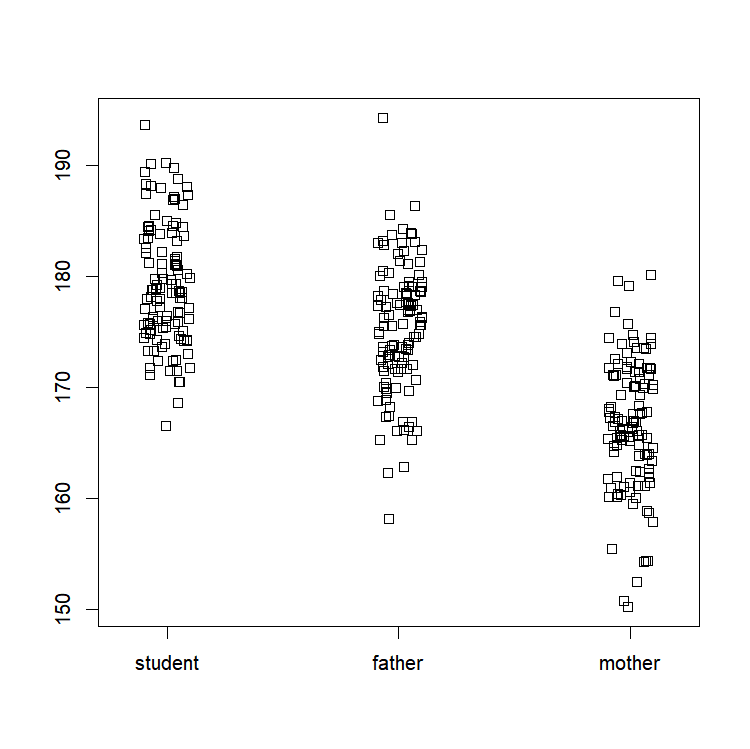
A QUICK LOOK AT OUR DATA
Basic plots for data exploration.
ACCESS, EXTRACT AND MERGE DATA?
a.k.a. Data management 101
CONCLUSION
The return of the sequel…